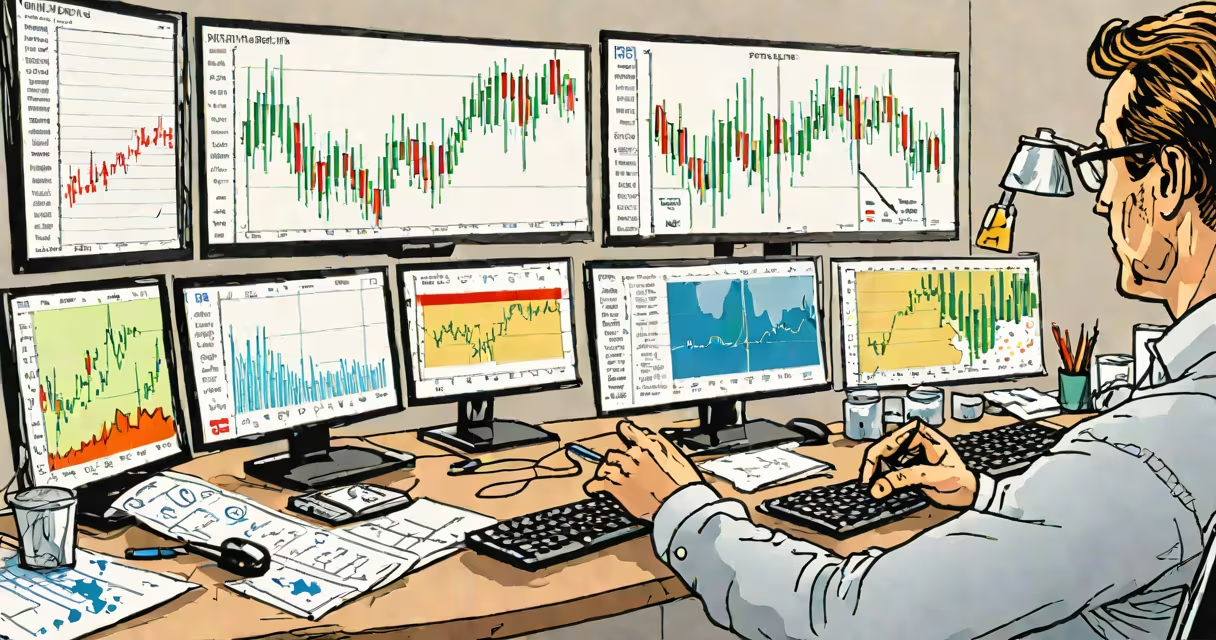
Volatility trading is a strategy that profits from changes in the rate of price movement in financial assets, not from the direction of those movements. Traders buy or sell instruments tied to volatility levels-like options or volatility indexes-based on expectations about future price swings.
Unlike directional trading, which bets on whether a stock will rise or fall, volatility trading focuses on how much, how fast, and how unpredictably prices move. The core idea is that volatility itself can be traded as a standalone asset class, especially through derivatives.
For example, the CBOE Volatility Index (VIX), often called the "fear gauge," tracks expected market volatility based on S&P 500 index options. When traders expect turbulence, VIX rises. When calm returns, it falls. Traders can go long or short on VIX futures or options to profit from shifts in market anxiety.
Volatility trading relies on measuring and forecasting how much prices fluctuate over time. High volatility means larger price swings in shorter periods. Low volatility means stable, slow-moving markets. Traders assess these conditions using statistical tools like standard deviation and historical volatility calculations.
Implied volatility (IV), derived from option pricing models such as Black-Scholes, reflects market expectations of future movement. If IV is high, options cost more because uncertainty is priced in. If IV is low, options are cheaper. Traders exploit mispricings between actual and expected volatility.
A common strategy is selling options when implied volatility is elevated-charging higher premiums-and buying them back later when volatility cools. This is known as volatility selling or "short gamma." Conversely, buying options during low IV periods offers use on sudden spikes in market fear.
Traders use several instruments to gain exposure to volatility. Options are central: calls and puts on stocks, indices, or ETFs allow direct bets on volatility changes. For example, buying a straddle-a simultaneous call and put at the same strike-profits if the underlying moves sharply in either direction.
Exchange-traded products (ETPs) provide direct access to volatility indices. The iPath S&P 500 VIX Short-Term Futures ETN (VXX) tracks near-term VIX futures. Traders use VXX to speculate on rising market fear. However, due to contango in futures markets, VXX tends to decay over time unless held for short durations.
| Instrument | Exposure Type | Use Case | Example |
|---|---|---|---|
| Options | Direct volatility | Betting on sharp moves | Buy a straddle on Apple ahead of earnings |
| VIX futures | Indirect volatility | Speculating on fear spikes | Sell VIX futures expecting calm post-FOMC meeting |
| ETPs (e.g., VXX) | Market volatility index | Short-term volatility plays | Go long VXX after a market crash |
Another tool is volatility arbitrage, where traders exploit differences between realized and implied volatility. If a stock's actual price swings exceed what options suggest, a trader may buy options and hedge the underlying position to lock in a profit regardless of direction.
Many assume volatility trading is purely speculative or only for hedge funds. In reality, retail traders use it daily via options strategies. But success requires understanding the difference between volatility and price direction.
A frequent mistake is confusing high volatility with upward movement. A stock can spike 10% in a day due to panic, not momentum. That's high volatility-but it doesn't mean the trend is bullish. Traders who mix up direction and volatility often lose money.
Another error is ignoring time decay. Options lose value as expiration nears, especially when volatility is low. Selling options during low IV can generate income, but if a surprise event triggers a jump in volatility, losses can accelerate quickly-especially with naked positions.
In March 2020, global markets plunged amid pandemic fears. The VIX surged from below 20 to over 80 in less than two weeks-the highest level since 2008. Traders who had sold VIX calls earlier were wiped out. Meanwhile, those who bought long-dated VIX calls or VXX ETFs saw massive gains.
According to a report by the CBOE, VIX futures contracts rose 300% in March 2020. Traders who understood that volatility was decoupling from price direction-meaning markets could fall while volatility spiked-could have positioned themselves profitably.
This illustrates a key insight: volatility isn't just noise. It's a measurable, tradable phenomenon. The 2020 crash showed that volatility can persist even after prices stabilize. After the initial drop, VIX remained elevated for months, creating opportunities for traders who held volatility positions beyond the immediate shock.
Volatility trading is essential for risk management in institutional portfolios. Asset managers use options to hedge against sudden downturns. They buy protective puts when volatility rises, reducing downside exposure.
For individual investors, understanding volatility helps avoid emotional decisions. A 5% drop in a stock isn't always a sign to sell-it could reflect normal volatility. Knowing the difference prevents reacting to noise.
One personal observation: I once ran a small options-based volatility portfolio during 2022's inflation surge. I used weekly SPY options to sell premium when IV was above average. Over six months, I generated consistent monthly income, even as the S&P 500 dropped 15%. The strategy worked because I wasn't betting on direction-I was betting on stability returning.
Volatility trading is not about predicting the future. It's about measuring uncertainty and capitalizing on mispricing between what the market expects and what actually happens.
Understanding volatility trading enhances decision-making across investing, hedging, and risk control. It separates reactive traders from those who anticipate market behavior based on measurable patterns.