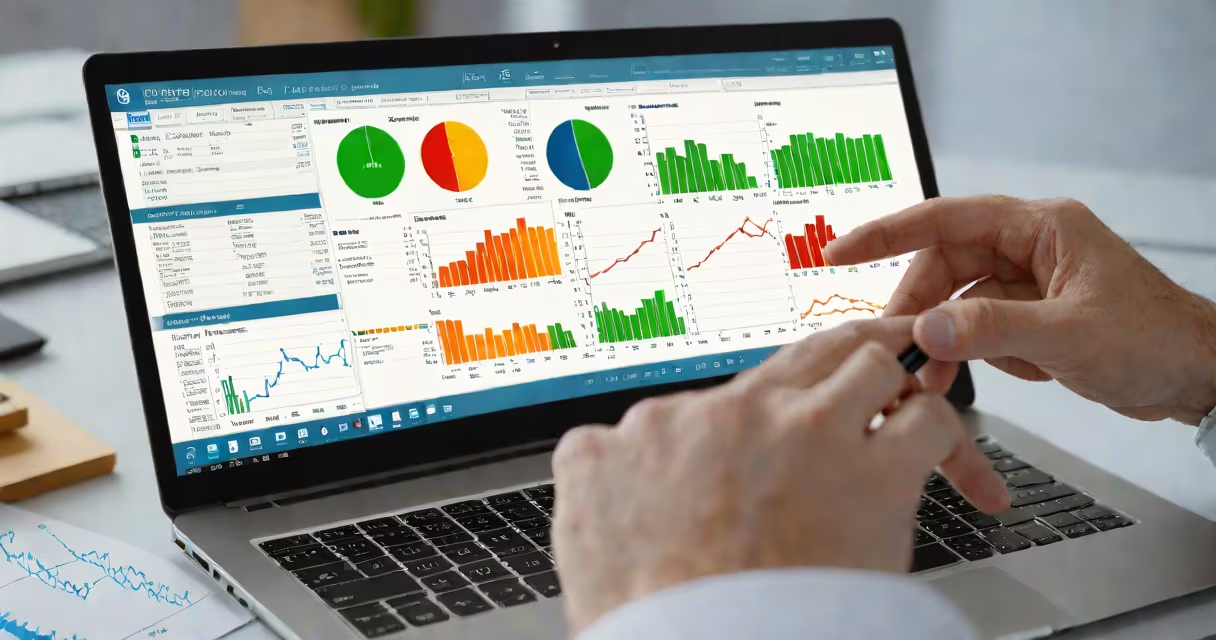
Data in statistics are recorded observations or measurements used to describe characteristics of a population or phenomenon. They form the foundation of every statistical analysis, enabling researchers to identify trends, test theories, and make evidence-based decisions.
Statistical data are not random numbers-they are systematically collected information about variables such as height, income, test scores, or customer behavior. These observations are organized, summarized, and interpreted using statistical methods to extract meaning.
For example, a survey asking 1,000 people their monthly grocery spending generates numerical data. When analyzed, this data reveals average spending, variation across regions, and potential correlations with income levels. Without data, statistical inference would have no basis.
Data in statistics serve as the input for descriptive and inferential analysis. Descriptive statistics summarize data using measures like mean, median, standard deviation, and frequency distributions. Inferential statistics go further-using sample data to estimate population parameters or test hypotheses.
Consider a pharmaceutical company testing a new drug. Researchers collect blood pressure readings from 200 patients before and after treatment. The resulting dataset includes paired values for each individual. Using a paired t-test, statisticians determine whether the observed drop in blood pressure is statistically significant-not due to chance.
This process relies on data being accurate, representative, and properly labeled. A single entry error-like recording 180 mmHg instead of 18 mmHg-can distort results. That's why data validation and cleaning are essential steps before analysis.
Statistical data fall into two broad categories: quantitative and qualitative. Quantitative data are numerical and measurable. Qualitative data are categorical and describe qualities or attributes.
| Type | Subtype | Examples | Use Case |
|---|---|---|---|
| Quantitative | Discrete | Number of children in a family (0, 1, 2) | Counting events or objects |
| Continuous | Weight, temperature, time | Measuring physical quantities | |
| Qualitative | Nominal | Eye color (blue, brown, green) | Grouping without order |
| Ordinal | Education level (high school, bachelor's, master's) | Ranking categories |
Understanding the type of data determines which statistical tools to apply. For instance, calculating a mean requires interval or ratio data-values where differences between numbers are meaningful. You cannot compute a mean for eye color because "blue" minus "brown" has no numerical interpretation.
A common mistake is treating ordinal data as interval. Rating satisfaction on a scale from 1 to 5 may seem numeric, but the difference between 1 and 2 isn't necessarily equal to the difference between 4 and 5. Using parametric tests like ANOVA on such data risks invalid conclusions.
Organizations across sectors rely on data in statistics to guide decisions. Healthcare uses patient data to track disease spread and evaluate treatment outcomes. Retailers analyze sales data to forecast demand and improve inventory. Governments use census data to allocate funding and plan infrastructure.
In 2020, the U.S. Centers for Disease Control and Prevention (CDC) used daily case counts and hospitalization rates to model the trajectory of the COVID-19 pandemic. These data informed public health policies, including lockdowns and vaccine rollout strategies. The accuracy of those models depended entirely on the quality and timeliness of the underlying data.
Another example: Netflix uses viewing data-how long users watch, pause, skip, or rerun shows-to refine content recommendations. This data informs production decisions, such as renewing series or investing in original programming. Each user interaction becomes part of a larger dataset used to improve user engagement.
Many assume data and information are interchangeable. But data are raw facts; information is data given context. A list of temperatures is data. Saying "the average temperature in July was 78°F" turns that data into information.
Another misconception is that more data always leads to better insight. High volume doesn't guarantee high quality. Garbage in, garbage out applies: flawed data collection methods produce misleading results. A 2016 study published in The Lancet found that 85% of clinical trial data were incomplete or inconsistently reported, undermining confidence in findings.
People often confuse correlation with causation. If ice cream sales rise alongside drowning incidents, it's tempting one causes the other. But both correlate with summer heat-a confounding variable. Proper statistical modeling controls for such factors to avoid false conclusions.
I once helped design a survey for a local nonprofit tracking food insecurity in urban neighborhoods. We asked 300 households about meal frequency, access to transportation, and household income. Initial responses showed 42% reported skipping meals weekly.
After cross-checking with city food bank records, we discovered the survey had misclassified "occasionally" as "frequently." Adjusting the wording reduced the reported rate to 28%. This small change altered program targeting. It taught me that data quality hinges on precise language and careful design.
Mastering data in statistics begins with learning how to define variables, choose appropriate measurement scales, and clean datasets. Tools like Python, R, and Excel enable efficient data manipulation and visualization.
Data in statistics are not just numbers-they are the language of evidence. When used correctly, they reveal truths hidden in complexity.