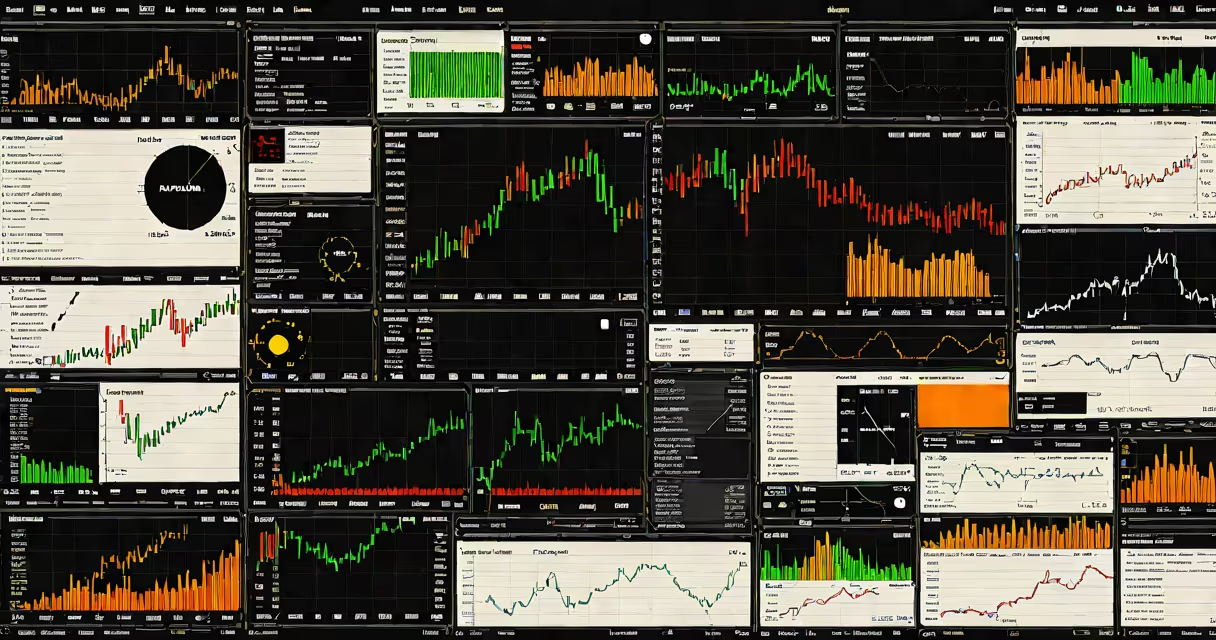
Option trading tools are software applications and platform features that deliver real-time data, analytical models, and strategy simulation capabilities to support informed decisions in options markets. They help traders evaluate risk, price derivatives, and manage portfolios efficiently.
These tools integrate market data feeds, volatility modeling, and scenario testing to simulate outcomes under different market conditions. Traders use them to identify mispriced options, backtest strategies, and monitor exposure across multiple contracts. Without them, executing advanced strategies like spreads, straddles, or iron condors would require extensive manual calculations and real-time monitoring.
For example, a trader analyzing Apple Inc. (AAPL) options might use a tool to compare implied volatility against historical volatility. If implied volatility is 30% and historical is 18%, the tool flags potential overpricing. The trader can then test a short strangle strategy using the platform's built-in calculator, which estimates profit and loss at various expiration dates and stock prices.
Option trading tools process live market data from exchanges like the CBOE and NYSE Arca. They calculate key metrics such as delta, gamma, theta, vega, and rho-collectively known as the Greeks-to quantify sensitivity to changes in underlying price, time decay, volatility, and interest rates.
Behind the scenes, these tools run algorithms that update bid/ask spreads, volume, open interest, and order book depth. They also incorporate predictive models based on historical patterns and machine learning to forecast volatility shifts. For instance, a tool may show a sudden spike in put volume relative to call volume, signaling potential bearish sentiment.
Many platforms offer visualizations like heatmaps of implied volatility across strike prices and expiration dates. These help traders spot anomalies-such as a "volatility smile" indicating higher demand for out-of-the-money options-which can inform directional bias or hedging decisions.
Traders rely on several categories of tools, each serving distinct functions:
| Type | Purpose | Examples |
|---|---|---|
| Option chain displays | Show all available strikes and expirations with bid/ask spreads and volume | Thinkorswim, Interactive Brokers Trader Workstation |
| Strategy calculators | Simulate profits and losses for multi-leg strategies | OptionsPlay, OptionStrat |
| Volatility forecasting tools | Model expected volatility using GARCH or Monte Carlo methods | QuantConnect, Alpha Vantage API |
| Alert systems | Send notifications when price thresholds or volume spikes occur | TradingView, MetaTrader 4 with custom scripts |
Some tools also offer paper trading environments-simulated accounts using real-time data-where users can test strategies without risking capital. This feature is especially useful for beginners learning how credit spreads behave during earnings announcements.
Many new traders assume that option trading tools eliminate risk. That's incorrect. Tools reduce uncertainty and improve accuracy, but they don't remove market risk. A tool may show a 70% probability of profit for a butterfly spread, but if the underlying stock gaps down due to unexpected news, the trade still loses money.
Another misunderstanding is that all tools are equally accurate. Accuracy varies widely. Free tools often lack depth in data sourcing or delay updates by seconds. Professional-grade platforms like Bloomberg Terminal or Cboe's Volatility Index (VIX) data feed charge premium fees because they deliver low-latency, high-fidelity data.
A lesser-known issue is model dependency. Some tools rely on the Black-Scholes model, which assumes constant volatility and log-normal returns. But real markets exhibit volatility clustering and fat tails. When a tool uses Black-Scholes to price an option during a market crash, it may underestimate the true risk-leading to poor hedging choices.
I once used a free web-based option chain tool to set up a calendar spread on Tesla (TSLA) options. The tool showed a positive theta and low initial cost. I entered the trade expecting minimal risk. Two days later, Tesla announced a production delay. The stock dropped 8%. The tool didn't account for event risk-only statistical volatility. My position lost 60% of its value in a single session.
This taught me that no tool replaces understanding of fundamentals and macro drivers. Even the most advanced analytics fail when the underlying assumption-that markets move predictably-is broken.
For context, the CBOE's official documentation states that implied volatility is forward-looking and reflects market expectations, not past behavior. This distinction matters: a tool showing high IV doesn't mean the option is overvalued-it may reflect anticipated events. Always cross-check with news flow and earnings calendars.
According to Investopedia, over 70% of retail options traders lose money in their first year. Many cite poor tool selection or overreliance on automated signals as contributing factors. Using tools without understanding their limitations increases failure risk.
Traders should treat option trading tools as decision aids-not replacements for judgment. Start with basic tools like free option chains on Yahoo Finance or Google Finance. As skill grows, upgrade to platforms offering backtesting, risk heatmaps, and integrated brokerage access.