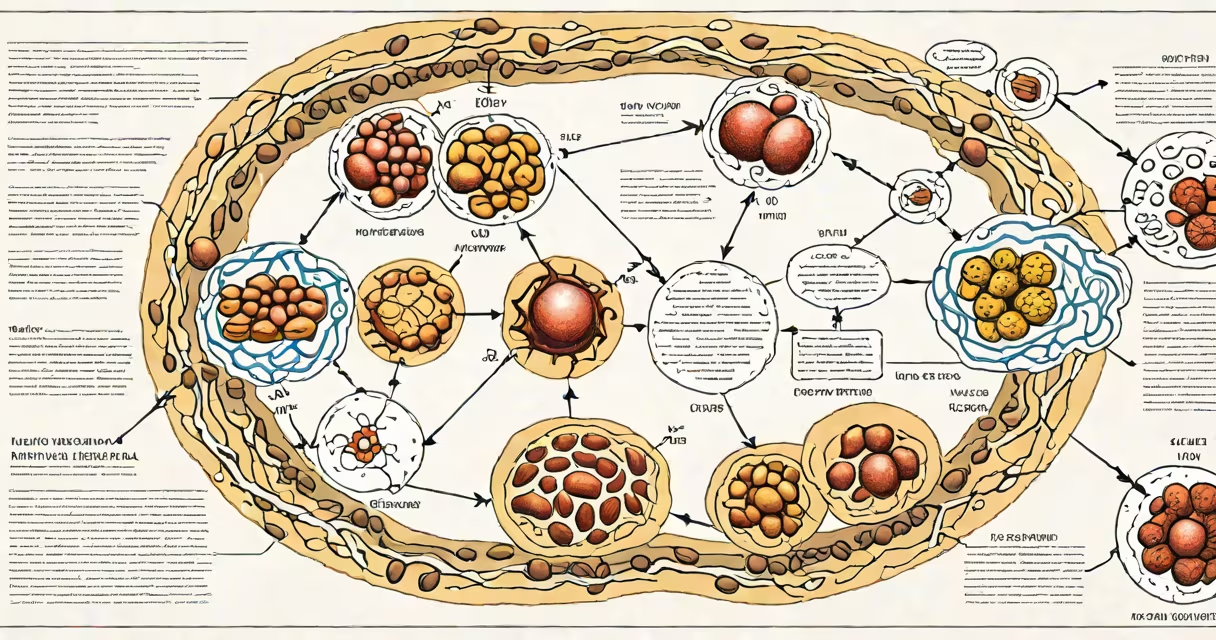
A metabolism diagram explanation maps the biochemical pathways that convert food into cellular energy, primarily through glycolysis, the Krebs cycle, and oxidative phosphorylation. These diagrams show how glucose, fats, and proteins are broken down into ATP, the energy currency of cells.
Metabolic pathways operate in sequence within cells, especially in mitochondria. The diagram traces the flow of carbon atoms from nutrients to energy molecules. For example, one glucose molecule yields up to 36 ATP through coordinated enzyme actions. Diagrams often label key intermediates like pyruvate, acetyl-CoA, and NADH to track electron transfer.
These visualizations simplify complex processes. They are used in biology education, medical training, and research. A well-designed diagram clarifies cause-and-effect relationships between inputs, enzymes, and outputs. Misinterpretations arise when viewers assume all steps happen simultaneously or ignore regulatory feedback loops.
Each metabolism diagram follows a standardized layout: reactants enter on the left, products exit on the right, and enzymes are shown as catalysts in between. Arrows indicate directionality, while branching paths represent alternative routes under different conditions.
For instance, during fasting, the liver shifts from glycolysis to gluconeogenesis. A correct diagram shows this switch via dashed lines and regulatory markers. Enzymes like hexokinase and citrate synthase appear at key junctions, emphasizing control points. Missing these details leads to oversimplified models that fail in clinical contexts.
Diagrams also track redox reactions. Electrons removed from substrates are passed to coenzymes like NAD+ and FAD. These reduced forms then feed electrons into the electron transport chain. The chain's proton gradient drives ATP synthesis. A diagram that omits this link misrepresents energy conversion efficiency.
Common pathways depicted include glycolysis, the Krebs cycle, fatty acid oxidation, and amino acid catabolism. Each has distinct entry points and end products.
| Pathway | Input | Key Output | Location |
|---|---|---|---|
| Glycolysis | Glucose (6 carbons) | 2 pyruvate, 2 ATP, 2 NADH | Cytoplasm |
| Krebs Cycle | Acetyl-CoA (2 carbons) | 3 NADH, 1 FADH₂, 1 ATP, CO₂ | Mitochondrial matrix |
| Oxidative Phosphorylation | NADH, FADH₂ | ~32 ATP, H₂O | Inner mitochondrial membrane |
Some diagrams integrate multiple pathways. A composite view may show glucose entering glycolysis, then pyruvate moving to mitochondria for conversion to acetyl-CoA. This illustrates metabolic flexibility-the ability to switch fuels based on availability.
Another layer is regulation. Feedback inhibition appears as a dotted line from ATP back to phosphofructokinase in glycolysis. High ATP signals the cell to slow down energy production. Omitting such controls creates misleading representations of metabolic balance.
Medical students use metabolism diagrams to understand disease mechanisms. For example, in diabetes, insulin resistance disrupts glucose uptake. A diagram highlighting GLUT4 translocation errors clarifies why blood sugar remains high despite normal insulin levels.
Researchers use them to model drug effects. Metformin, a diabetes medication, inhibits complex I in the electron transport chain. A detailed diagram shows this blockade reducing ATP yield and increasing AMPK activation, which promotes glucose uptake.
Health coaches sometimes misuse simplified versions. One common error is claiming "fat burning" begins only after 20 minutes of exercise. But fat oxidation occurs continuously, even at rest. A proper diagram shows fatty acids entering the mitochondria via carnitine shuttle and being broken down through beta-oxidation. The rate increases with intensity, but the pathway exists regardless of time spent exercising.
Many assume metabolism is solely about weight loss. But it includes biosynthesis, detoxification, and signaling. A diagram focused only on calorie burning ignores anabolic processes like protein synthesis and lipid storage.
Another misconception is that all energy comes from glucose. In reality, fatty acids provide more ATP per gram than glucose. One palmitic acid molecule generates 106 ATP after complete oxidation. A balanced diagram accounts for substrate diversity.
There's also confusion around mitochondrial function. Some think mitochondria "burn" fuel like a furnace. But they don't produce heat directly. Instead, protons leak across the inner membrane, dissipating energy as heat. This process, called uncoupling, is regulated by UCP1 in brown adipose tissue. A correct diagram shows this as a controlled bypass, not a failure.
I once observed a student draw a metabolism diagram with all pathways flowing in one direction. When asked why no feedback existed, they replied, "I thought it was linear." That misunderstanding led to incorrect predictions about nutrient overload. Proper diagrams include regulatory nodes to reflect biological reality.
Consider a patient with elevated fasting glucose. A metabolism diagram explains why. Glucose enters the cell via GLUT4 transporters. Insulin triggers their movement to the membrane. Without insulin signaling, GLUT4 stays inside the cell.
Once inside, glucose undergoes glycolysis. But in insulin-resistant cells, the enzyme PFK-1 becomes less active. This slows the entire pathway. Pyruvate accumulates, and excess glucose remains in the blood. A diagram showing this bottleneck highlights the root issue-not lack of glucose, but blocked access.
Further downstream, pyruvate dehydrogenase requires activated coenzyme A. In high-fat diets, acetyl-CoA builds up and inhibits the enzyme. This prevents pyruvate from entering the Krebs cycle. The result? Reduced ATP and increased lactate production-leading to fatigue and insulin resistance.
This layered explanation reveals how a single diagram can connect molecular events to systemic symptoms. It shows why treating diabetes requires targeting multiple points, not just lowering blood sugar.
Understanding a metabolism diagram explanation requires recognizing both structure and context. It's not just a flowchart-it's a changing model of cellular life. The most accurate diagrams include regulatory checkpoints, alternative pathways, and spatial organization within organelles.