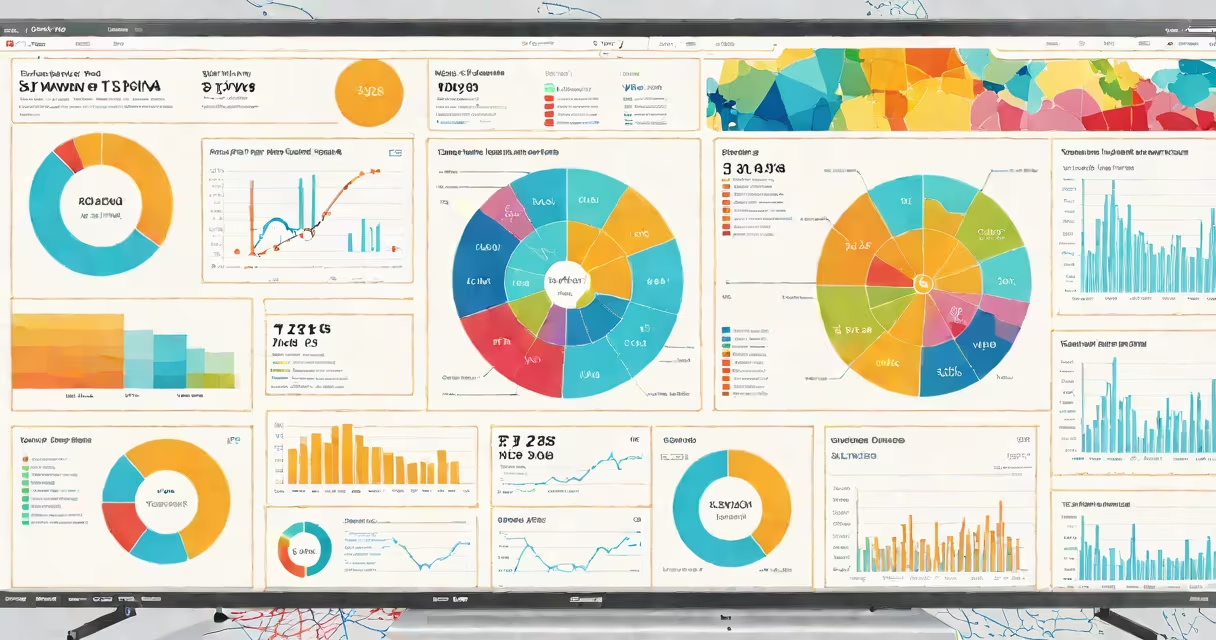
Big data analytics examples involve using advanced computational techniques to extract actionable insights from large, complex datasets that traditional methods cannot process efficiently. These applications drive decisions in industries ranging from healthcare to e-commerce by identifying patterns, predicting outcomes, and automating responses.
Organizations collect vast volumes of structured and unstructured data-transaction logs, sensor readings, social media posts, clickstreams-and apply statistical models, machine learning algorithms, and distributed computing frameworks to analyze them. The goal is not just to store or visualize data, but to generate predictions, detect anomalies, and recommend actions based on historical and real-time inputs.
For example, a major U.S. grocery chain uses big data analytics to adjust inventory levels across 1,200 stores. By analyzing weather forecasts, local event schedules, and past purchase data, the system predicts demand spikes for specific products-like hot dogs during a city festival-and automatically triggers restocking orders. This reduces spoilage by 18% and increases product availability during peak times.
Big data analytics relies on four core processes: ingestion, storage, processing, and visualization. Data flows in from multiple sources-APIs, databases, IoT devices, web crawlers-then gets stored in scalable systems like Hadoop Distributed File System (HDFS) or cloud-based data lakes.
Processing happens through batch or stream analysis. Batch processing handles large volumes of historical data (e.g., monthly sales records), while stream processing analyzes live data feeds (e.g., real-time website clicks). Tools like Apache Spark and Flink enable high-speed computation across clusters of servers.
Finally, results appear in dashboards, reports, or automated alerts. A financial institution might flag a transaction as potentially fraudulent if it occurs at 3 a.m. in a country where the cardholder has never traveled, based on behavioral patterns learned from millions of prior transactions.
There are four primary categories of big data analytics, each serving different strategic purposes:
| Type | Purpose | Example Application |
|---|---|---|
| Descriptive | Summarizes past events | Monthly report showing customer churn rate by region |
| Diagnostic | Finds causes behind trends | Identifying that a 30% drop in app usage correlates with server outages in the Midwest |
| Predictive | Forecasts future outcomes | Forecasting which customers are likely to cancel subscriptions within 60 days |
| Prescriptive | Suggests optimal actions | Recommending the best time to send a promotional email based on individual user engagement history |
Many organizations combine these types. For instance, Netflix uses descriptive analytics to track viewing habits, diagnostic analytics to understand why certain shows perform better in specific demographics, predictive models to estimate the success of new original content, and prescriptive recommendations to personalize home screens.
Healthcare providers use big data analytics to reduce hospital readmissions. A study published in *The Journal of the American Medical Informatics Association* found that hospitals applying predictive models based on electronic health records reduced 30-day readmission rates by 12% compared to control groups. Algorithms flagged patients at risk based on lab values, medication adherence, and social determinants of health.
In logistics, UPS optimized delivery routes using real-time traffic data, fuel prices, and package weight. Their ORION (On-Road Integrated Optimization and Navigation) system processes 2.4 million daily packages and reduces annual mileage by 100 million miles, saving $400 million in fuel costs and cutting carbon emissions by 100,000 metric tons annually.
Financial institutions deploy big data analytics to detect fraud. JPMorgan Chase uses machine learning models trained on 10 years of transaction data to identify suspicious activity. The system flags over 2 million potential fraud cases annually, reducing false positives by 40% compared to older rule-based systems.
Big data analytics is not synonymous with artificial intelligence. While AI often powers the analysis, big data refers to the scale and complexity of the input data. A spreadsheet with 10,000 rows is not "big data" by industry standards-systems handling petabytes of data across thousands of nodes qualify.
Another misconception: big data analytics always requires custom software. Many off-the-shelf tools-such as Tableau, Power BI, and Google BigQuery-offer built-in support for querying large datasets without writing low-level code. A small retailer can analyze 500,000 customer transactions using Google's BigQuery with SQL-like syntax and pay only for compute time used.
A key distinction: big data analytics focuses on insight generation, not data collection itself. The value lies in transforming raw data into decisions. For example, a fitness tracker company collects heart rate data from 10 million users-but only derives value when it identifies early signs of atrial fibrillation in a subset of users, enabling proactive medical referrals.
I once worked with a regional bank to implement a credit risk model using big data analytics. We combined internal loan data with external variables-unemployment rates, housing price indexes, and even local news sentiment scores derived from social media. The model predicted default likelihood with 87% accuracy, outperforming traditional scoring methods by 14 percentage points. After deployment, the bank reduced high-risk lending by 22% without impacting loan volume.
This project highlighted a critical point: context matters. The model failed initially because it didn't account for seasonal hiring patterns in rural areas. Once we added local employment data from government labor reports, performance improved. That adjustment wasn't in the original dataset-it came from domain expertise integrated into the analytical pipeline.
Big data analytics examples demonstrate measurable impact across sectors. They turn vast, messy data into clear, timely decisions. Whether optimizing supply chains, improving patient outcomes, or preventing financial crime, these applications rely on accurate data, sound modeling, and human oversight-not magic.
Understanding big data analytics examples helps organizations avoid hype and focus on practical implementation. Start with a clear objective-reduce customer churn, lower energy consumption, or improve response times-and build from there. Tools and platforms exist to support this work, but success still depends on defining the right problem and validating results with real-world outcomes.